
The combination of InfluxDB, Telegraf and Grafana lets you collect and visualise almost any data. Here is who is doing what:
- InfluxDB is a time-series database
- Telegraf is an agent collecting data and sending it to InfluxDB
- Grafana is a tool to visualize data using dashboard. Is supports, InfluxDB as a data source, amonst many others.
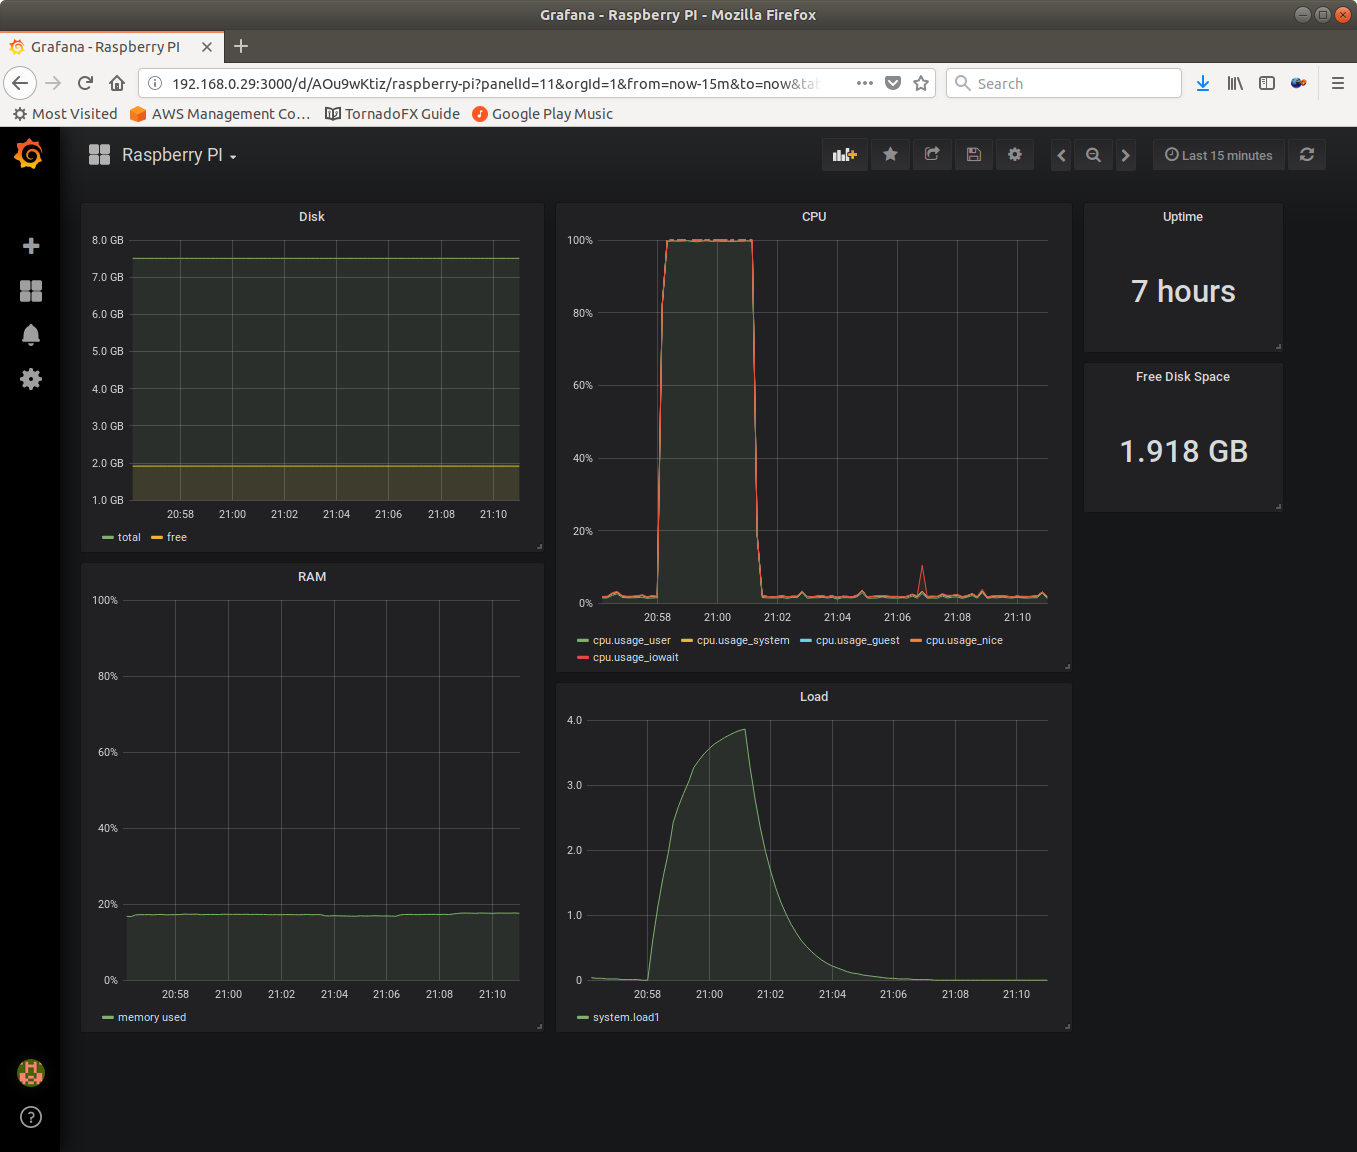
The result of this tutorial will be a nice dashboard of the system usage on a Raspberry PI.
Install the components
InfluxDB and Telegraf are available from the InfluxData apt repo.
echo "deb https://repos.influxdata.com/debian stretch stable" | sudo tee /etc/apt/sources.list.d/influxdb.list
sudo apt-get update && sudo apt-get install influxdb telegraf -y
Grafana on the other hand does not provide an apt repo for the ARM arch. We therefore download and install the Debian package manually.
wget https://s3-us-west-2.amazonaws.com/grafana-releases/release/grafana_5.2.2_armhf.deb
sudo dpkg -i grafana_5.2.2_armhf.deb
Configuration
Telegraf and InfluxDB provide a default configuration and start to collect data immediately. We can directly proceed to Grafana.
Open the Grafana UI using a browser: http://192.168.0.xx:3000.
The default username is admin/admin.
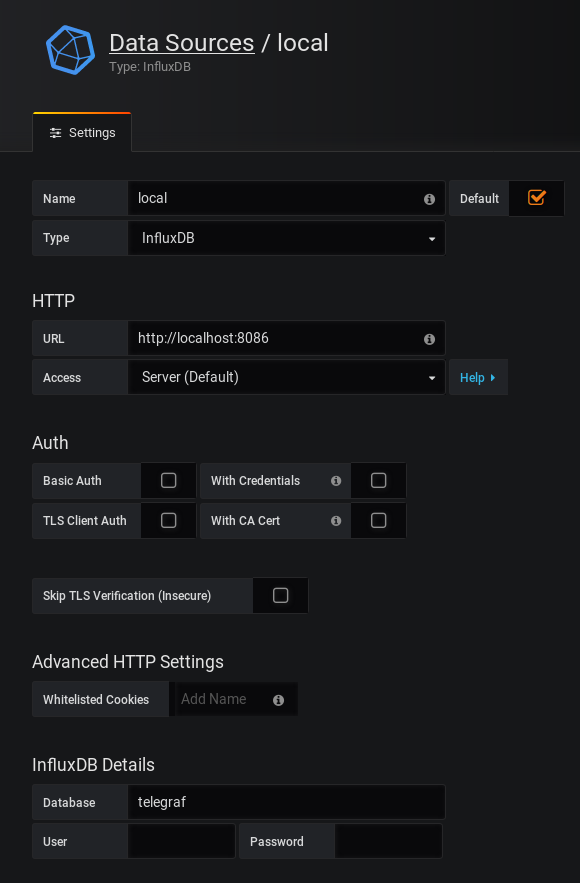
Add the following InfluxDB data source:
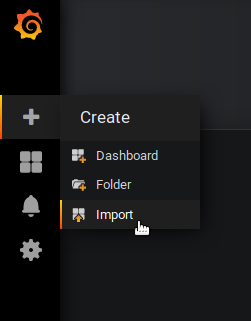
We’re pretty much done now. The only thing missing is a dashboard showing the data. You can either create your own or import mine:
{
"__inputs": [
{
"name": "DS_LOCAL",
"label": "local",
"description": "",
"type": "datasource",
"pluginId": "influxdb",
"pluginName": "InfluxDB"
}
],
"__requires": [
{
"type": "grafana",
"id": "grafana",
"name": "Grafana",
"version": "5.2.2"
},
{
"type": "panel",
"id": "graph",
"name": "Graph",
"version": "5.0.0"
},
{
"type": "datasource",
"id": "influxdb",
"name": "InfluxDB",
"version": "5.0.0"
},
{
"type": "panel",
"id": "singlestat",
"name": "Singlestat",
"version": "5.0.0"
}
],
"annotations": {
"list": [
{
"builtIn": 1,
"datasource": "-- Grafana --",
"enable": true,
"hide": true,
"iconColor": "rgba(0, 211, 255, 1)",
"name": "Annotations & Alerts",
"type": "dashboard"
}
]
},
"editable": true,
"gnetId": null,
"graphTooltip": 0,
"id": null,
"links": [],
"panels": [
{
"aliasColors": {},
"bars": false,
"dashLength": 10,
"dashes": false,
"datasource": "${DS_LOCAL}",
"fill": 1,
"gridPos": {
"h": 9,
"w": 9,
"x": 0,
"y": 0
},
"id": 4,
"legend": {
"avg": false,
"current": false,
"max": false,
"min": false,
"show": true,
"total": false,
"values": false
},
"lines": true,
"linewidth": 1,
"links": [],
"nullPointMode": "null",
"percentage": false,
"pointradius": 5,
"points": false,
"renderer": "flot",
"seriesOverrides": [],
"spaceLength": 10,
"stack": false,
"steppedLine": false,
"targets": [
{
"alias": "total",
"groupBy": [],
"measurement": "disk",
"orderByTime": "ASC",
"policy": "default",
"refId": "A",
"resultFormat": "time_series",
"select": [
[
{
"params": [
"total"
],
"type": "field"
}
]
],
"tags": [
{
"key": "path",
"operator": "=",
"value": "/"
}
]
},
{
"alias": "free",
"groupBy": [],
"measurement": "disk",
"orderByTime": "ASC",
"policy": "default",
"refId": "B",
"resultFormat": "time_series",
"select": [
[
{
"params": [
"free"
],
"type": "field"
}
]
],
"tags": [
{
"key": "path",
"operator": "=",
"value": "/"
}
]
}
],
"thresholds": [],
"timeFrom": null,
"timeShift": null,
"title": "Disk",
"tooltip": {
"shared": true,
"sort": 0,
"value_type": "individual"
},
"type": "graph",
"xaxis": {
"buckets": null,
"mode": "time",
"name": null,
"show": true,
"values": []
},
"yaxes": [
{
"format": "decbytes",
"label": null,
"logBase": 1,
"max": null,
"min": null,
"show": true
},
{
"format": "short",
"label": null,
"logBase": 1,
"max": null,
"min": null,
"show": true
}
],
"yaxis": {
"align": false,
"alignLevel": null
}
},
{
"aliasColors": {},
"bars": false,
"dashLength": 10,
"dashes": false,
"datasource": "${DS_LOCAL}",
"fill": 1,
"gridPos": {
"h": 12,
"w": 10,
"x": 9,
"y": 0
},
"id": 5,
"legend": {
"avg": false,
"current": false,
"max": false,
"min": false,
"show": true,
"total": false,
"values": false
},
"lines": true,
"linewidth": 1,
"links": [],
"nullPointMode": "null",
"percentage": false,
"pointradius": 5,
"points": false,
"renderer": "flot",
"seriesOverrides": [],
"spaceLength": 10,
"stack": true,
"steppedLine": false,
"targets": [
{
"alias": "",
"groupBy": [],
"hide": false,
"measurement": "cpu",
"orderByTime": "ASC",
"policy": "default",
"refId": "A",
"resultFormat": "time_series",
"select": [
[
{
"params": [
"usage_user"
],
"type": "field"
}
],
[
{
"params": [
"usage_system"
],
"type": "field"
}
],
[
{
"params": [
"usage_guest"
],
"type": "field"
}
],
[
{
"params": [
"usage_nice"
],
"type": "field"
}
],
[
{
"params": [
"usage_iowait"
],
"type": "field"
}
]
],
"tags": [
{
"key": "cpu",
"operator": "=",
"value": "cpu-total"
}
]
}
],
"thresholds": [],
"timeFrom": null,
"timeShift": null,
"title": "CPU",
"tooltip": {
"shared": true,
"sort": 0,
"value_type": "individual"
},
"type": "graph",
"xaxis": {
"buckets": null,
"mode": "time",
"name": null,
"show": true,
"values": []
},
"yaxes": [
{
"decimals": null,
"format": "percent",
"label": null,
"logBase": 1,
"max": "100",
"min": "0",
"show": true
},
{
"format": "short",
"label": null,
"logBase": 1,
"max": null,
"min": null,
"show": true
}
],
"yaxis": {
"align": false,
"alignLevel": null
}
},
{
"cacheTimeout": null,
"colorBackground": false,
"colorValue": false,
"colors": [
"#299c46",
"rgba(237, 129, 40, 0.89)",
"#d44a3a"
],
"datasource": "${DS_LOCAL}",
"format": "dtdurations",
"gauge": {
"maxValue": 100,
"minValue": 0,
"show": false,
"thresholdLabels": false,
"thresholdMarkers": true
},
"gridPos": {
"h": 4,
"w": 4,
"x": 19,
"y": 0
},
"id": 9,
"interval": null,
"links": [],
"mappingType": 1,
"mappingTypes": [
{
"name": "value to text",
"value": 1
},
{
"name": "range to text",
"value": 2
}
],
"maxDataPoints": 100,
"nullPointMode": "connected",
"nullText": null,
"postfix": "",
"postfixFontSize": "50%",
"prefix": "",
"prefixFontSize": "50%",
"rangeMaps": [
{
"from": "null",
"text": "N/A",
"to": "null"
}
],
"sparkline": {
"fillColor": "rgba(31, 118, 189, 0.18)",
"full": false,
"lineColor": "rgb(31, 120, 193)",
"show": false
},
"tableColumn": "",
"targets": [
{
"groupBy": [],
"measurement": "system",
"orderByTime": "ASC",
"policy": "default",
"refId": "A",
"resultFormat": "time_series",
"select": [
[
{
"params": [
"uptime"
],
"type": "field"
}
]
],
"tags": []
}
],
"thresholds": "",
"title": "Uptime",
"type": "singlestat",
"valueFontSize": "80%",
"valueMaps": [
{
"op": "=",
"text": "N/A",
"value": "null"
}
],
"valueName": "current"
},
{
"cacheTimeout": null,
"colorBackground": false,
"colorValue": false,
"colors": [
"#299c46",
"rgba(237, 129, 40, 0.89)",
"#d44a3a"
],
"datasource": "${DS_LOCAL}",
"format": "decbytes",
"gauge": {
"maxValue": 100,
"minValue": 0,
"show": false,
"thresholdLabels": false,
"thresholdMarkers": true
},
"gridPos": {
"h": 4,
"w": 4,
"x": 19,
"y": 4
},
"id": 11,
"interval": null,
"links": [],
"mappingType": 1,
"mappingTypes": [
{
"name": "value to text",
"value": 1
},
{
"name": "range to text",
"value": 2
}
],
"maxDataPoints": 100,
"nullPointMode": "connected",
"nullText": null,
"postfix": "",
"postfixFontSize": "50%",
"prefix": "",
"prefixFontSize": "50%",
"rangeMaps": [
{
"from": "null",
"text": "N/A",
"to": "null"
}
],
"sparkline": {
"fillColor": "rgba(31, 118, 189, 0.18)",
"full": false,
"lineColor": "rgb(31, 120, 193)",
"show": false
},
"tableColumn": "",
"targets": [
{
"groupBy": [],
"measurement": "disk",
"orderByTime": "ASC",
"policy": "default",
"refId": "A",
"resultFormat": "time_series",
"select": [
[
{
"params": [
"free"
],
"type": "field"
}
]
],
"tags": [
{
"key": "path",
"operator": "=",
"value": "/"
}
]
}
],
"thresholds": "",
"title": "Free Disk Space",
"type": "singlestat",
"valueFontSize": "80%",
"valueMaps": [
{
"op": "=",
"text": "N/A",
"value": "null"
}
],
"valueName": "current"
},
{
"aliasColors": {},
"bars": false,
"dashLength": 10,
"dashes": false,
"datasource": "${DS_LOCAL}",
"fill": 1,
"gridPos": {
"h": 12,
"w": 9,
"x": 0,
"y": 9
},
"id": 2,
"legend": {
"avg": false,
"current": false,
"max": false,
"min": false,
"show": true,
"total": false,
"values": false
},
"lines": true,
"linewidth": 1,
"links": [],
"nullPointMode": "null",
"percentage": false,
"pointradius": 5,
"points": false,
"renderer": "flot",
"seriesOverrides": [],
"spaceLength": 10,
"stack": false,
"steppedLine": false,
"targets": [
{
"alias": "memory used",
"groupBy": [],
"measurement": "mem",
"orderByTime": "ASC",
"policy": "default",
"refId": "B",
"resultFormat": "time_series",
"select": [
[
{
"params": [
"used_percent"
],
"type": "field"
}
]
],
"tags": []
}
],
"thresholds": [],
"timeFrom": null,
"timeShift": null,
"title": "RAM",
"tooltip": {
"shared": true,
"sort": 0,
"value_type": "individual"
},
"type": "graph",
"xaxis": {
"buckets": null,
"mode": "time",
"name": null,
"show": true,
"values": []
},
"yaxes": [
{
"decimals": null,
"format": "percent",
"label": null,
"logBase": 1,
"max": "100",
"min": "0",
"show": true
},
{
"format": "short",
"label": null,
"logBase": 1,
"max": null,
"min": null,
"show": true
}
],
"yaxis": {
"align": false,
"alignLevel": null
}
},
{
"aliasColors": {},
"bars": false,
"dashLength": 10,
"dashes": false,
"datasource": "${DS_LOCAL}",
"fill": 1,
"gridPos": {
"h": 9,
"w": 10,
"x": 9,
"y": 12
},
"id": 7,
"legend": {
"avg": false,
"current": false,
"max": false,
"min": false,
"show": true,
"total": false,
"values": false
},
"lines": true,
"linewidth": 1,
"links": [],
"nullPointMode": "null",
"percentage": false,
"pointradius": 5,
"points": false,
"renderer": "flot",
"seriesOverrides": [],
"spaceLength": 10,
"stack": false,
"steppedLine": false,
"targets": [
{
"groupBy": [],
"measurement": "system",
"orderByTime": "ASC",
"policy": "default",
"refId": "A",
"resultFormat": "time_series",
"select": [
[
{
"params": [
"load1"
],
"type": "field"
}
]
],
"tags": []
}
],
"thresholds": [],
"timeFrom": null,
"timeShift": null,
"title": "Load",
"tooltip": {
"shared": true,
"sort": 0,
"value_type": "individual"
},
"type": "graph",
"xaxis": {
"buckets": null,
"mode": "time",
"name": null,
"show": true,
"values": []
},
"yaxes": [
{
"format": "short",
"label": null,
"logBase": 1,
"max": "4",
"min": "0",
"show": true
},
{
"format": "short",
"label": null,
"logBase": 1,
"max": null,
"min": null,
"show": true
}
],
"yaxis": {
"align": false,
"alignLevel": null
}
}
],
"schemaVersion": 16,
"style": "dark",
"tags": [],
"templating": {
"list": []
},
"time": {
"from": "now-5m",
"to": "now"
},
"timepicker": {
"refresh_intervals": [
"5s",
"10s",
"30s",
"1m",
"5m",
"15m",
"30m",
"1h",
"2h",
"1d"
],
"time_options": [
"5m",
"15m",
"1h",
"6h",
"12h",
"24h",
"2d",
"7d",
"30d"
]
},
"timezone": "",
"title": "Raspberry PI",
"uid": "AOu9wKtiz",
"version": 6
}
Next steps
This setup is completely unsecured. Unless you trust all members of your network, you should definitely enable authentication on InfluxDB as well as Grafana.
Telegraf has an impressive list of input plugins to collect data. You can easily collect whatever data your application exposes and then create a Grafana dashboard for it.