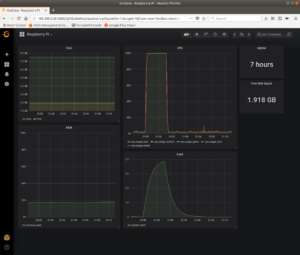
One of the notable Spring Boot 2 features is the introduction of Micrometer (SLF4J for application metrics).
Spring Boot ships with a whole series of built-in metrics collecting JVM metrics (memory usage, garbage collection, threads, and classes), CPU usage, Tomcat metrics as well as others.
Continue reading “Send Spring Boot Metrics into InfluxDB and Grafana”

