The combination of InfluxDB, Telegraf and Grafana lets you collect and visualise almost any data. Here is who is doing what:
- InfluxDB is a time-series database
- Telegraf is an agent collecting data and sending it to InfluxDB
- Grafana is a tool to visualize data using dashboard. Is supports, InfluxDB as a data source, amonst many others.
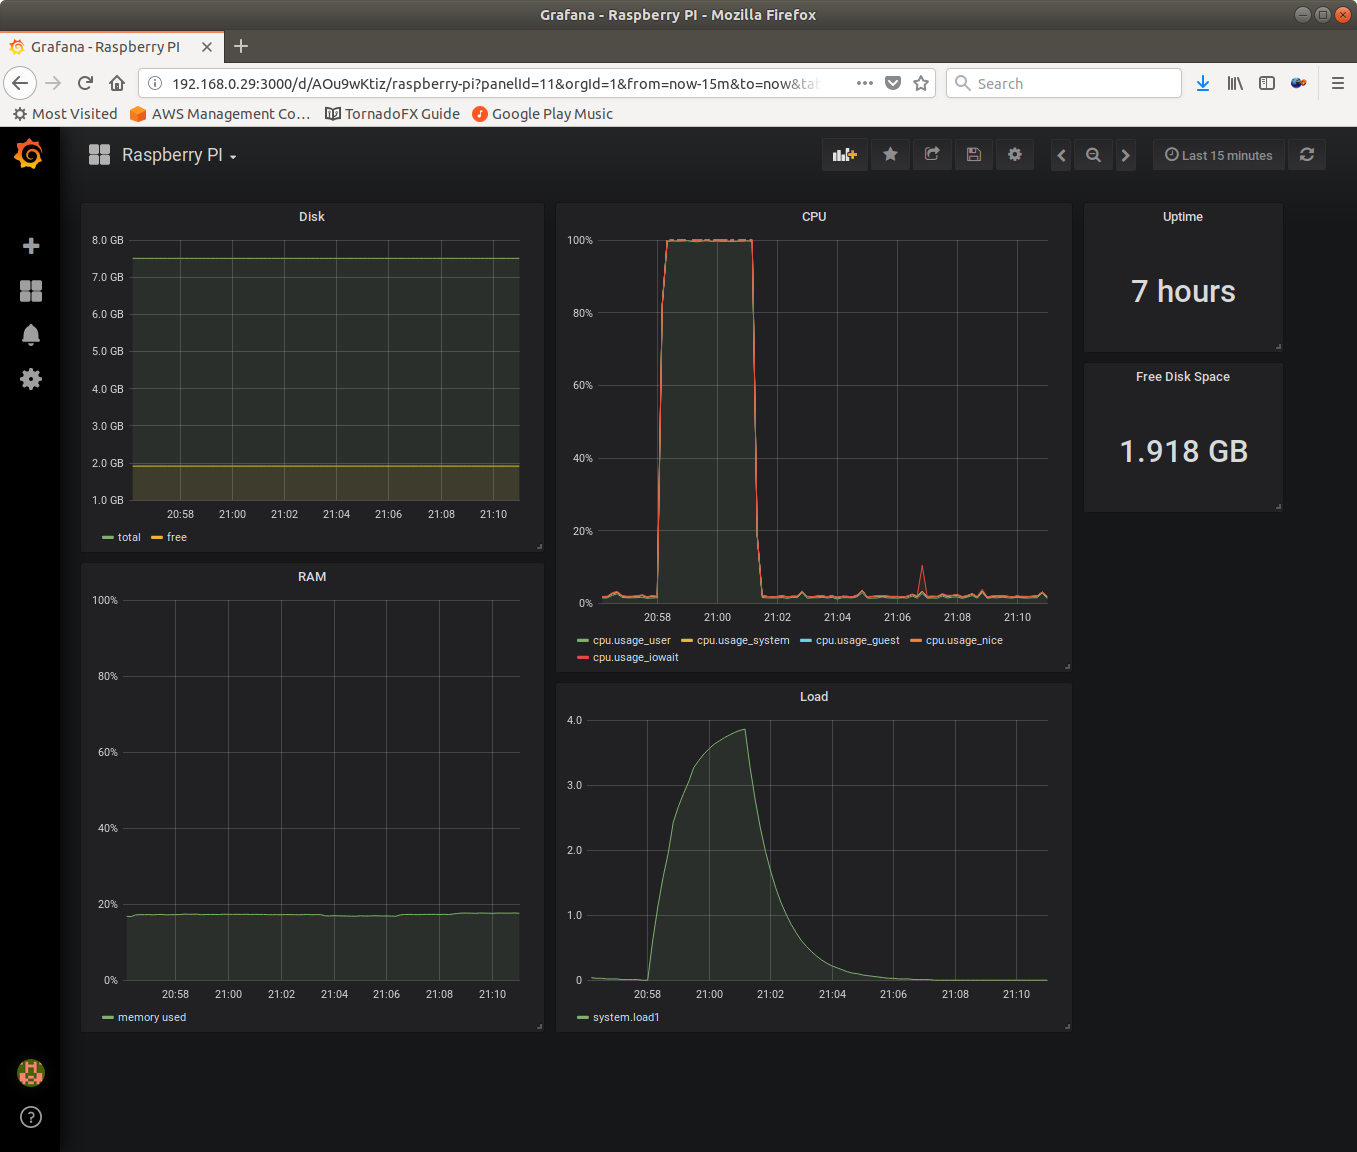
The result of this tutorial will be a nice dashboard of the system usage on a Raspberry PI.
Continue reading “InfluxDB, Telegraf and Grafana on a Raspberry PI”